


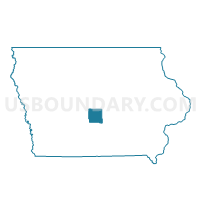
Census Tract 107.02, Polk County, Iowa
About
Outline

Summary
| Unique Area Identifier | 457776 |
| Name | Census Tract 107.02 |
| County | Polk County |
| State | Iowa |
| Area (square miles) | 68.57 |
| Land Area (square miles) | 67.77 |
| Water Area (square miles) | 0.80 |
| % of Land Area | 98.83 |
| % of Water Area | 1.17 |
| Latitude of the Internal Point | 41.58993910 |
| Longtitude of the Internal Point | -93.38736860 |
| Total Population | 5,701 |
| Total Housing Units | 1,955 |
| Total Households | 1,854 |
| Median Age | 39.3 |
Maps

Graphs
Select a template below for downloading or customizing gragh for Census Tract 107.02, Polk County, Iowa


Neighbors
Neighoring Census Tract (by Name) Neighboring Census Tract on the Map
- Census Tract 101.02, Polk County, IA
- Census Tract 107.03, Polk County, IA
- Census Tract 107.05, Polk County, IA
- Census Tract 107.06, Polk County, IA
- Census Tract 108.02, Polk County, IA
- Census Tract 108.04, Polk County, IA
- Census Tract 205, Warren County, IA
- Census Tract 301, Marion County, IA
- Census Tract 402, Jasper County, IA
- Census Tract 407, Jasper County, IA
Top 10 Neighboring County Subdivision (by Population) Neighboring County Subdivision on the Map
- Clay township, Polk County, IA (16,022)
- Four Mile township, Polk County, IA (9,250)
- Beaver township, Polk County, IA (3,032)
- Pleasant Grove township, Marion County, IA (2,769)
- Washington township, Jasper County, IA (2,714)
- Allen township, Polk County, IA (2,448)
- Des Moines township, Jasper County, IA (2,212)
- Camp township, Polk County, IA (2,183)
- Richland township, Warren County, IA (1,260)
- Red Rock township, Marion County, IA (596)
Top 10 Neighboring Place (by Population) Neighboring Place on the Map
- Altoona city, IA (14,541)
- Pleasant Hill city, IA (8,785)
- Mitchellville city, IA (2,254)
- Runnells city, IA (507)
Top 10 Neighboring Unified School District (by Population) Neighboring Unified School District on the Map
- Southeast Polk Community School District, IA (31,979)
- Carlisle Community School District, IA (8,414)
- Bondurant-Farrar Community School District, IA (6,275)
- PCM Community School District, IA (5,681)
- Colfax-Mingo Community School District, IA (4,409)
- Pleasantville Community School District, IA (3,427)
Top 10 Neighboring State Legislative District Lower Chamber (by Population) Neighboring State Legislative District Lower Chamber on the Map
- State House District 67, IA (37,653)
- State House District 42, IA (36,928)
- State House District 73, IA (32,505)
- State House District 71, IA (30,841)
Top 10 Neighboring State Legislative District Upper Chamber (by Population) Neighboring State Legislative District Upper Chamber on the Map
- State Senate District 34, IA (69,287)
- State Senate District 37, IA (66,229)
- State Senate District 21, IA (65,772)
- State Senate District 36, IA (59,364)
Top 10 Neighboring 111th Congressional District (by Population) Neighboring 111th Congressional District on the Map
Top 10 Neighboring 5-Digit ZIP Code Tabulation Area (by Population) Neighboring 5-Digit ZIP Code Tabulation Area on the Map
- 50009, IA (16,136)
- 50327, IA (10,467)
- 50047, IA (5,559)
- 50035, IA (5,387)
- 50237, IA (3,095)
- 50169, IA (3,093)
- 50228, IA (2,417)
- 50118, IA (1,027)
- 50252, IA (243)
Data
Demographic, Population, Households, and Housing Units
** Data sources from census 2010 **
Show Data on Map
Download Full List as CSV
Download Quick Sheet as CSV
| Subject | This Area | Polk County | Iowa | National |
|---|---|---|---|---|
| POPULATION | ||||
| Total Population Map | 5,701 | 430,640 | 3,046,355 | 308,745,538 |
| POPULATION, HISPANIC OR LATINO ORIGIN | ||||
| Not Hispanic or Latino Map | 5,563 | 397,993 | 2,894,811 | 258,267,944 |
| Hispanic or Latino Map | 138 | 32,647 | 151,544 | 50,477,594 |
| POPULATION, RACE | ||||
| White alone Map | 5,419 | 364,895 | 2,781,561 | 223,553,265 |
| Black or African American alone Map | 150 | 25,853 | 89,148 | 38,929,319 |
| American Indian and Alaska Native alone Map | 30 | 1,384 | 11,084 | 2,932,248 |
| Asian alone Map | 38 | 15,220 | 53,094 | 14,674,252 |
| Native Hawaiian and Other Pacific Islander alone Map | 1 | 254 | 2,003 | 540,013 |
| Some Other Race alone Map | 25 | 12,629 | 56,132 | 19,107,368 |
| Two or More Races Map | 38 | 10,405 | 53,333 | 9,009,073 |
| POPULATION, SEX | ||||
| Male Map | 2,561 | 211,171 | 1,508,319 | 151,781,326 |
| Female Map | 3,140 | 219,469 | 1,538,036 | 156,964,212 |
| POPULATION, AGE (18 YEARS) | ||||
| 18 years and over Map | 4,283 | 320,715 | 2,318,362 | 234,564,071 |
| Under 18 years | 1,418 | 109,925 | 727,993 | 74,181,467 |
| POPULATION, AGE | ||||
| Under 5 years | 342 | 32,816 | 202,123 | 20,201,362 |
| 5 to 9 years | 400 | 30,863 | 200,646 | 20,348,657 |
| 10 to 14 years | 430 | 29,445 | 200,904 | 20,677,194 |
| 15 to 17 years | 246 | 16,801 | 124,320 | 12,954,254 |
| 18 and 19 years | 126 | 11,007 | 92,517 | 9,086,089 |
| 20 years | 45 | 5,661 | 47,227 | 4,519,129 |
| 21 years | 44 | 5,026 | 44,695 | 4,354,294 |
| 22 to 24 years | 158 | 18,180 | 121,428 | 12,712,576 |
| 25 to 29 years | 321 | 35,237 | 197,843 | 21,101,849 |
| 30 to 34 years | 393 | 32,261 | 184,740 | 19,962,099 |
| 35 to 39 years | 422 | 29,631 | 177,148 | 20,179,642 |
| 40 to 44 years | 528 | 29,894 | 187,400 | 20,890,964 |
| 45 to 49 years | 482 | 30,903 | 216,482 | 22,708,591 |
| 50 to 54 years | 447 | 29,396 | 223,244 | 22,298,125 |
| 55 to 59 years | 388 | 25,835 | 204,393 | 19,664,805 |
| 60 and 61 years | 109 | 9,207 | 72,152 | 7,113,727 |
| 62 to 64 years | 180 | 11,932 | 96,205 | 9,704,197 |
| 65 and 66 years | 99 | 6,139 | 52,304 | 5,319,902 |
| 67 to 69 years | 122 | 8,235 | 72,061 | 7,115,361 |
| 70 to 74 years | 154 | 10,376 | 100,291 | 9,278,166 |
| 75 to 79 years | 106 | 8,302 | 83,387 | 7,317,795 |
| 80 to 84 years | 81 | 6,779 | 70,187 | 5,743,327 |
| 85 years and over | 78 | 6,714 | 74,658 | 5,493,433 |
| MEDIAN AGE BY SEX | ||||
| Both sexes Map | 39.30 | 34.70 | 38.10 | 37.20 |
| Male Map | 39.70 | 33.70 | 36.60 | 35.80 |
| Female Map | 38.90 | 35.60 | 39.50 | 38.50 |
| HOUSEHOLDS | ||||
| Total Households Map | 1,854 | 170,197 | 1,221,576 | 116,716,292 |
| HOUSEHOLDS, HOUSEHOLD TYPE | ||||
| Family households: Map | 1,442 | 108,321 | 790,034 | 77,538,296 |
| Husband-wife family Map | 1,272 | 82,125 | 625,173 | 56,510,377 |
| Other family: Map | 170 | 26,196 | 164,861 | 21,027,919 |
| Male householder, no wife present Map | 60 | 7,420 | 51,105 | 5,777,570 |
| Female householder, no husband present Map | 110 | 18,776 | 113,756 | 15,250,349 |
| Nonfamily households: Map | 412 | 61,876 | 431,542 | 39,177,996 |
| Householder living alone Map | 336 | 48,127 | 347,479 | 31,204,909 |
| Householder not living alone Map | 76 | 13,749 | 84,063 | 7,973,087 |
| HOUSEHOLDS, HISPANIC OR LATINO ORIGIN OF HOUSEHOLDER | ||||
| Not Hispanic or Latino householder: Map | 1,830 | 162,139 | 1,184,389 | 103,254,926 |
| Hispanic or Latino householder: Map | 24 | 8,058 | 37,187 | 13,461,366 |
| HOUSEHOLDS, RACE OF HOUSEHOLDER | ||||
| Householder who is White alone | 1,822 | 150,988 | 1,147,691 | 89,754,352 |
| Householder who is Black or African American alone | 6 | 8,932 | 29,305 | 14,129,983 |
| Householder who is American Indian and Alaska Native alone | 3 | 462 | 3,414 | 939,707 |
| Householder who is Asian alone | 6 | 4,549 | 15,860 | 4,632,164 |
| Householder who is Native Hawaiian and Other Pacific Islander alone | 0 | 74 | 476 | 143,932 |
| Householder who is Some Other Race alone | 8 | 3,203 | 14,481 | 4,916,427 |
| Householder who is Two or More Races | 9 | 1,989 | 10,349 | 2,199,727 |
| HOUSEHOLDS, HOUSEHOLD TYPE BY HOUSEHOLD SIZE | ||||
| Family households: Map | 1,442 | 108,321 | 790,034 | 77,538,296 |
| 2-person household Map | 638 | 45,741 | 379,328 | 31,882,616 |
| 3-person household Map | 262 | 24,555 | 162,734 | 17,765,829 |
| 4-person household Map | 322 | 22,245 | 142,197 | 15,214,075 |
| 5-person household Map | 143 | 10,105 | 68,261 | 7,411,997 |
| 6-person household Map | 48 | 3,535 | 24,263 | 3,026,278 |
| 7-or-more-person household Map | 29 | 2,140 | 13,251 | 2,237,501 |
| Nonfamily households: Map | 412 | 61,876 | 431,542 | 39,177,996 |
| 1-person household Map | 336 | 48,127 | 347,479 | 31,204,909 |
| 2-person household Map | 66 | 11,526 | 66,548 | 6,360,012 |
| 3-person household Map | 8 | 1,558 | 10,678 | 992,156 |
| 4-person household Map | 2 | 482 | 5,088 | 411,171 |
| 5-person household Map | 0 | 123 | 1,269 | 126,634 |
| 6-person household Map | 0 | 36 | 316 | 48,421 |
| 7-or-more-person household Map | 0 | 24 | 164 | 34,693 |
| HOUSING UNITS | ||||
| Total Housing Units Map | 1,955 | 182,262 | 1,336,417 | 131,704,730 |
| HOUSING UNITS, OCCUPANCY STATUS | ||||
| Occupied Map | 1,854 | 170,197 | 1,221,576 | 116,716,292 |
| Vacant Map | 101 | 12,065 | 114,841 | 14,988,438 |
| HOUSING UNITS, OCCUPIED, TENURE | ||||
| Owned with a mortgage or a loan Map | 1,228 | 90,742 | 573,988 | 52,979,430 |
| Owned free and clear Map | 356 | 26,789 | 306,647 | 23,006,644 |
| Renter occupied Map | 270 | 52,666 | 340,941 | 40,730,218 |
| HOUSING UNITS, VACANT, VACANCY STATUS | ||||
| For rent Map | 13 | 4,728 | 31,812 | 4,137,567 |
| Rented, not occupied Map | 1 | 231 | 1,803 | 206,825 |
| For sale only Map | 30 | 2,861 | 18,405 | 1,896,796 |
| Sold, not occupied Map | 7 | 573 | 5,555 | 421,032 |
| For seasonal, recreational, or occasional use Map | 5 | 705 | 21,020 | 4,649,298 |
| For migrant workers Map | 1 | 7 | 87 | 24,161 |
| Other vacant Map | 44 | 2,960 | 36,159 | 3,652,759 |
| HOUSING UNITS, OCCUPIED, AVERAGE HOUSEHOLD SIZE BY TENURE | ||||
| Total: Map | 2.74 | 2.48 | 2.41 | 2.58 |
| Owner occupied Map | 2.84 | 2.61 | 2.52 | 2.65 |
| Renter occupied Map | 2.14 | 2.16 | 2.14 | 2.44 |
| HOUSING UNITS, OCCUPIED, TENURE BY RACE OF HOUSEHOLDER | ||||
| Owner occupied: Map | 1,584 | 117,531 | 880,635 | 75,986,074 |
| Householder who is White alone Map | 1,558 | 109,106 | 849,767 | 63,446,275 |
| Householder who is Black or African American alone Map | 5 | 3,044 | 9,110 | 6,261,464 |
| Householder who is American Indian and Alaska Native alone Map | 2 | 220 | 1,585 | 509,588 |
| Householder who is Asian alone Map | 6 | 2,770 | 8,306 | 2,688,861 |
| Householder who is Native Hawaiian and Other Pacific Islander alone Map | 0 | 32 | 160 | 61,911 |
| Householder who is Some Other Race alone Map | 6 | 1,438 | 6,837 | 1,975,817 |
| Householder who is Two or More Races Map | 7 | 921 | 4,870 | 1,042,158 |
| Renter occupied: Map | 270 | 52,666 | 340,941 | 40,730,218 |
| Householder who is White alone Map | 264 | 41,882 | 297,924 | 26,308,077 |
| Householder who is Black or African American alone Map | 1 | 5,888 | 20,195 | 7,868,519 |
| Householder who is American Indian and Alaska Native alone Map | 1 | 242 | 1,829 | 430,119 |
| Householder who is Asian alone Map | 0 | 1,779 | 7,554 | 1,943,303 |
| Householder who is Native Hawaiian and Other Pacific Islander alone Map | 0 | 42 | 316 | 82,021 |
| Householder who is Some Other Race alone Map | 2 | 1,765 | 7,644 | 2,940,610 |
| Householder who is Two or More Races Map | 2 | 1,068 | 5,479 | 1,157,569 |
| HOUSING UNITS, OCCUPIED, TENURE BY HISPANIC OR LATINO ORIGIN OF HOUSEHOLDER | ||||
| Owner occupied: Map | 1,584 | 117,531 | 880,635 | 75,986,074 |
| Not Hispanic or Latino householder Map | 1,565 | 113,467 | 861,741 | 69,617,625 |
| Hispanic or Latino householder Map | 19 | 4,064 | 18,894 | 6,368,449 |
| Renter occupied: Map | 270 | 52,666 | 340,941 | 40,730,218 |
| Not Hispanic or Latino householder Map | 265 | 48,672 | 322,648 | 33,637,301 |
| Hispanic or Latino householder Map | 5 | 3,994 | 18,293 | 7,092,917 |
| HOUSING UNITS, OCCUPIED, TENURE BY HOUSEHOLD SIZE | ||||
| Owner occupied: Map | 1,584 | 117,531 | 880,635 | 75,986,074 |
| 1-person household Map | 204 | 25,552 | 197,923 | 16,453,569 |
| 2-person household Map | 651 | 42,932 | 355,975 | 27,618,605 |
| 3-person household Map | 240 | 18,992 | 127,879 | 12,517,563 |
| 4-person household Map | 290 | 18,033 | 115,932 | 10,998,793 |
| 5-person household Map | 129 | 7,925 | 54,480 | 5,057,765 |
| 6-person household Map | 44 | 2,642 | 18,720 | 1,965,796 |
| 7-or-more-person household Map | 26 | 1,455 | 9,726 | 1,373,983 |
| Renter occupied: Map | 270 | 52,666 | 340,941 | 40,730,218 |
| 1-person household Map | 132 | 22,575 | 149,556 | 14,751,340 |
| 2-person household Map | 53 | 14,335 | 89,901 | 10,624,023 |
| 3-person household Map | 30 | 7,121 | 45,533 | 6,240,422 |
| 4-person household Map | 34 | 4,694 | 31,353 | 4,626,453 |
| 5-person household Map | 14 | 2,303 | 15,050 | 2,480,866 |
| 6-person household Map | 4 | 929 | 5,859 | 1,108,903 |
| 7-or-more-person household Map | 3 | 709 | 3,689 | 898,211 |
Loading...